Can You Show Me What Happened?
Introducing ‘Compromise Canvas’ - Meet the tool incident responders built for themselves.
In my last post I walked you behind the scenes of how we at SagaLabs build scenarios from threat research to emulation and detailed lab development. And why the work we do at SagaLabs is rooted in real engagements and real attacker behavior.
What I didn’t address was what happens after the scenario is built, when you’re in the middle of a real compromise, alarms are lighting up like a Christmas tree, people are deep in their investigation, and someone suddenly asks:
Can you show me what happened?
If you’ve ever tried to answer that with a PowerPoint diagram, a Spreadsheet of Doom, or a photo of a whiteboard - you know how fast things fall apart.
I've always been tinkering and building tools that could help me or my team during incident response cases, and now with the help of LLMs and coding agents it's much easier to go from idea to MVP, to an actual application that can be used during an incident.
I needed a tool that simply could help me cover and structure an incident and showcase it in a manner that is easy for everyone to understand.
And I know that there are good alternatives out there, but I always felt like they were missing something...
A Compromise Is a Graph
First, I tried to design this tool with the following quote from John Lambert in mind:
Defenders think in lists. Attackers think in graphs. As long as this is true, attackers win.
I knew the tool needed the following structural building blocks:
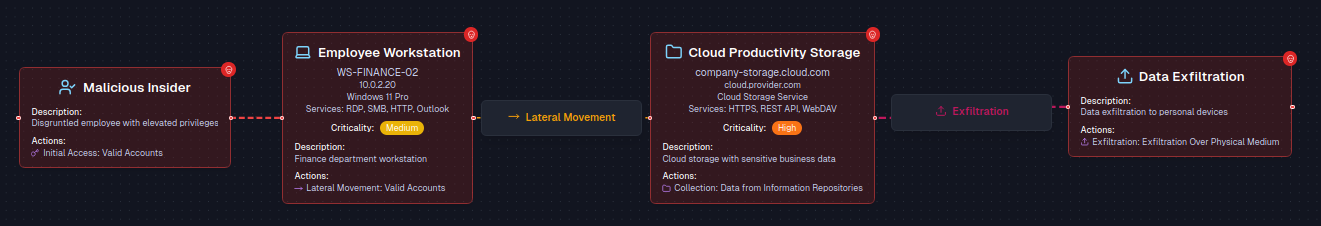
Nodes: assets, identities, workloads.
Edges: MITRE ATT&CK tactics: initial access, lateral movement, escalation.
Time: order matters.
State: compromised? Critical? Investigated?
That's how Compromise Canvas was born. (okay maybe with an absurd amount of tokens used by Claude)
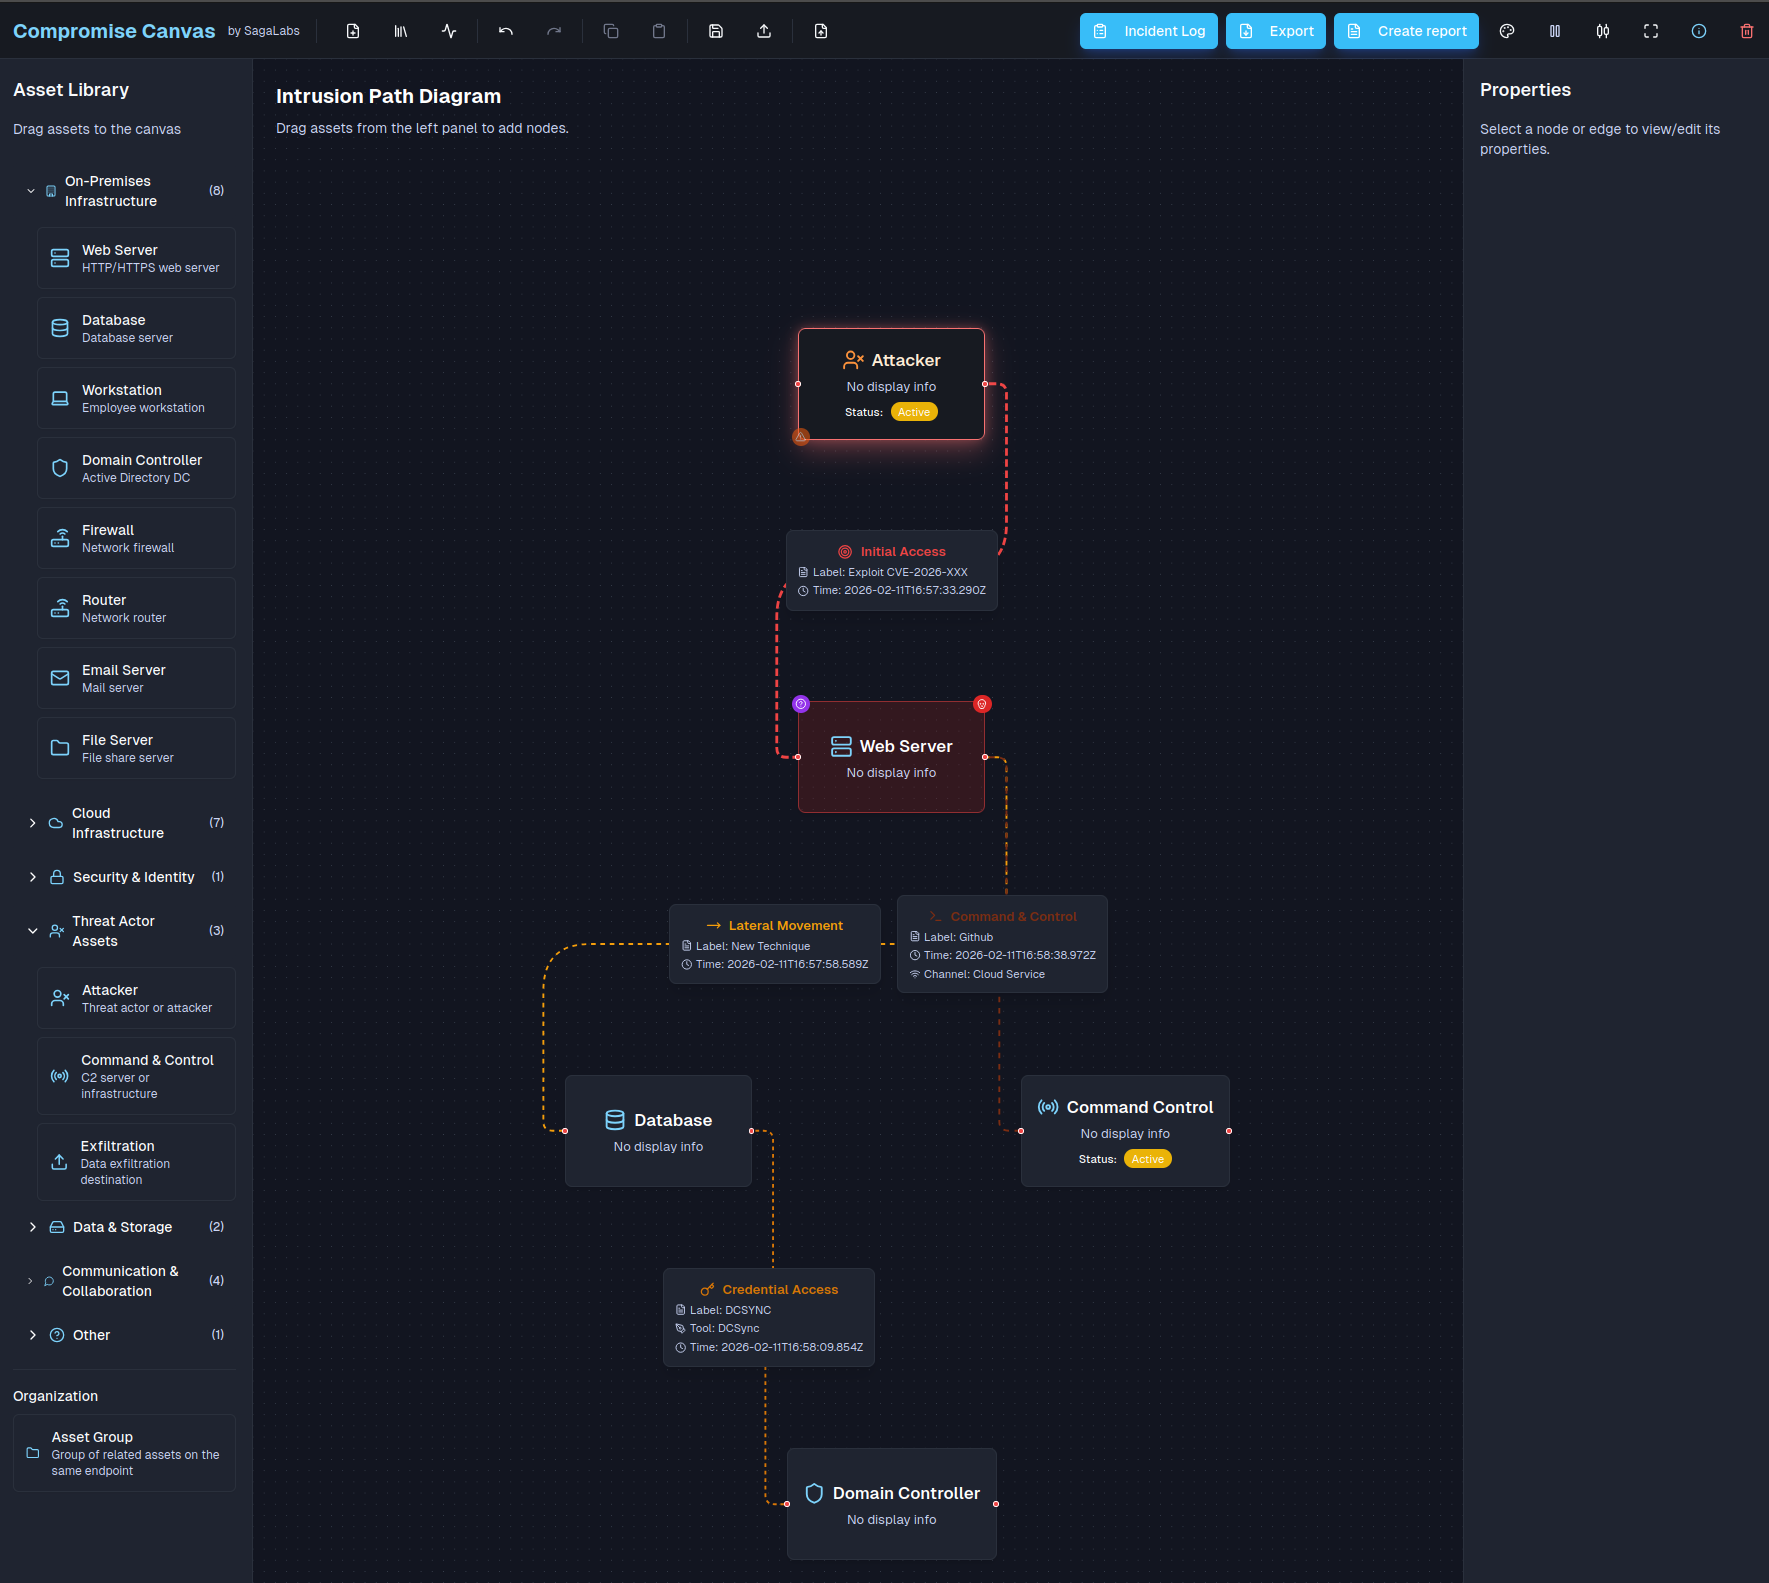
Compromise canvas features:
Drag-and-drop assets, grouped by On-Prem, Cloud, Identity, Threat Actors and more.
Our application, which is free to use, is hosted as a static web application, so nothing is stored on service-side, everything runs in the browser’s local storage.
Edges labeled with MITRE ATT&CK tactics like Lateral Movement and Privilege Escalation.
Criticality, compromised & investigation status on every node.
Automatic timeline generation from timestamps on edges.
A structured incident log alongside your graph.
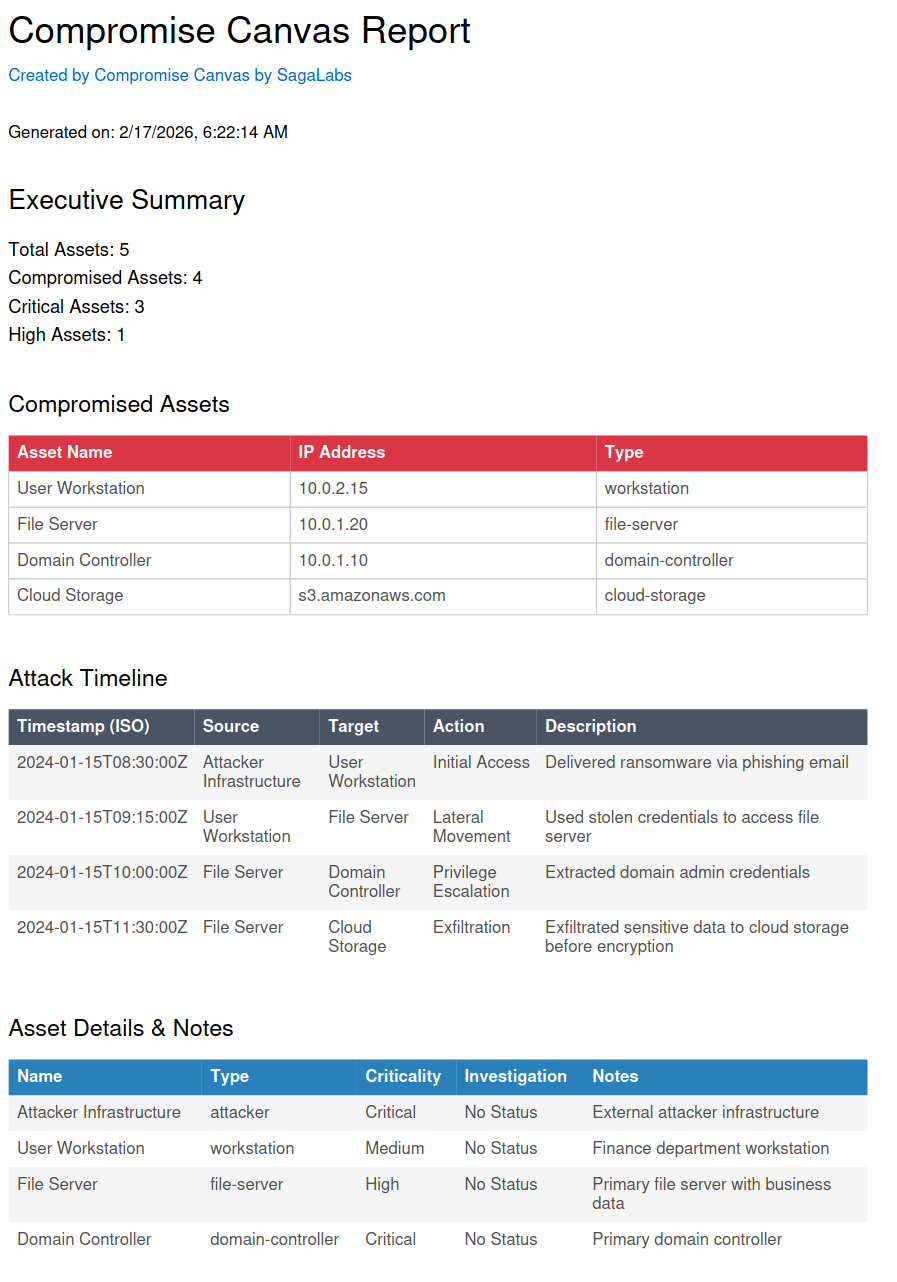
Another feature of the app is the ability to export everything into a nice report that will show nodes that have been marked as compromised, the timeline, incident log and other things useful for the more C-level like people that like reports... 🥱
Why this matters in Real Incidents
Most teams run awesome investigations on a few hosts. They triage hosts, gather evidence, correlate IOCs, and quickly chase down initial access.
But what happens when the incident gets so big that you lose track of the scope of the compromise?
A while back, we got pulled into an engagement that started with a single alert. The customer's SOC had flagged a machine that had a Cloudflare tunnel installed. Nobody in IT requested it. Nobody knew it was there.
We ran a triage acquisition on the host and determined that the threat actor originated from an old AD environment with no centralized monitoring tools, no EDR, nothing, leaving the customer and the SOC totally blind.
Our team started pulling triage images from this environment, and we quickly saw that it was heavily infected and spanned 45+ known-compromised servers. This required a solid plan for how we should track this, because we needed to track what was compromised, what had been investigated, and where the attacker had moved to.
This was the first time we used this tool, and it turned out to be super helpful for the customer and us, as we could follow the breadcrumbs to identify the initial access vector as an RDS gateway that was brute-forced.
How we use it to build an Adversary Emulation Plan
At SagaLabs, we emulate real incidents in our cyber range, and often these emulation plans can get quite scattered and unstructured, so we usually start by asking:
What should the compromise look like when it’s done?
Before a single VM is deployed in the cyber range, before any vulnerability is created and tuned, before any operator logs in, we open Compromise Canvas.
And we design the operation as a graph.
We use Compromise Canvas to:
Translate threat intelligence into operational plans.
Convert real-world incidents into controlled simulations.
Ensure that what we build in the cyber range reflects how attackers actually move.
And the interesting part?
The same tool we use to respond to incidents is the one we use to design them.
Whether you're defending against chaos or engineering it safely inside a lab, the underlying logic is the same.
Open Source
We decided to open-source the project, which means you can host it in your on-prem environment as well and fork it as you like. Maybe you want to hook a backend onto it to make it easier to store your canvas. You can, as we decided to, use the GPL 3.0 license for it.
You can try the application here and find the source code below:
Try it: https://compromisecanvas.sagalabs.cloud
Source: https://github.com/SagaLabs/CompromiseCanvas
Unfortunately, this tool doesn’t offer multi-user collaboration at the time being, but I mean, it’s open source. Build it... 😊
Christian Henriksen
Sr. Incident Responder & Scenario Designer